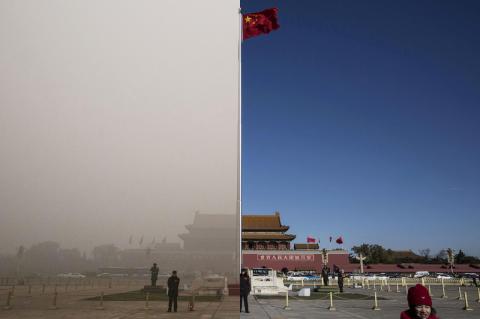
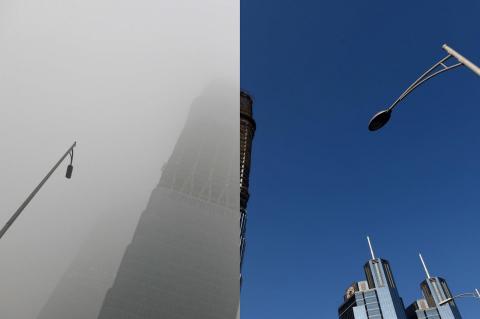
In 2014, the Chinese government announced a “war against pollution”, aiming to clean up the dangerous haze hanging over many parts of the country, especially Beijing. Data showed that pollution level in the city has declined steadily in the past few years.
PM2.5 – shorthand for particulate matter that is 2.5 micrometers in diameter or smaller, is known as the most harmful air pollutant. From 2014 to 2018, Beijing has seen its level of PM2.5 concentration dropped from 110 to 50 micrograms per cubic meter.
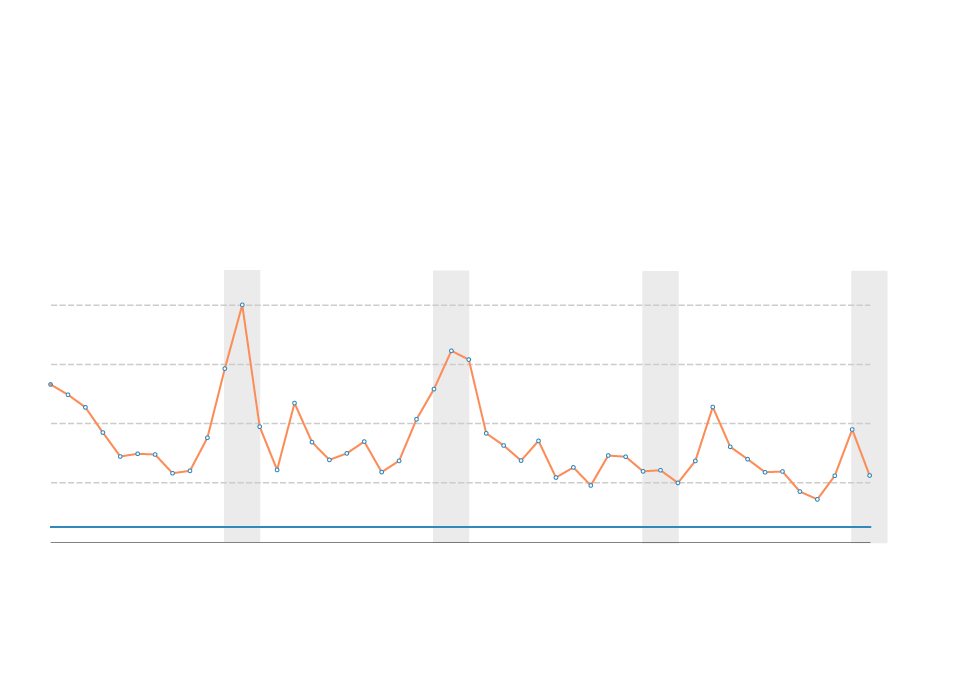
Outdoor Air Quality In Beijing By Month (2015 - 2018)
Measured by average PM2.5 concerntration
Winter:
November to January
China bans coal heating
160
μg/m3
120
80
40
WHO
Standard
10
2015
2016
2018
2017
2019
Outdoor Air Quality In Beijing By Month (2015 - 2018)
Measured by average PM2.5 concerntration
Winter:
November to January
China bans coal heating
160
μg/m3
120
80
40
WHO
Standard
10
2015
2016
2018
2017
2019
Outdoor Air Quality In Beijing By Month (2015 - 2018)
Measured by average PM2.5 concerntration
Winter
November to January
China bans coal heating
160
μg/m3
120
80
40
WHO
Standard
10
2015
2016
2018
2017
2019
Source: Beijing Municipal Environmental Monitoring Center
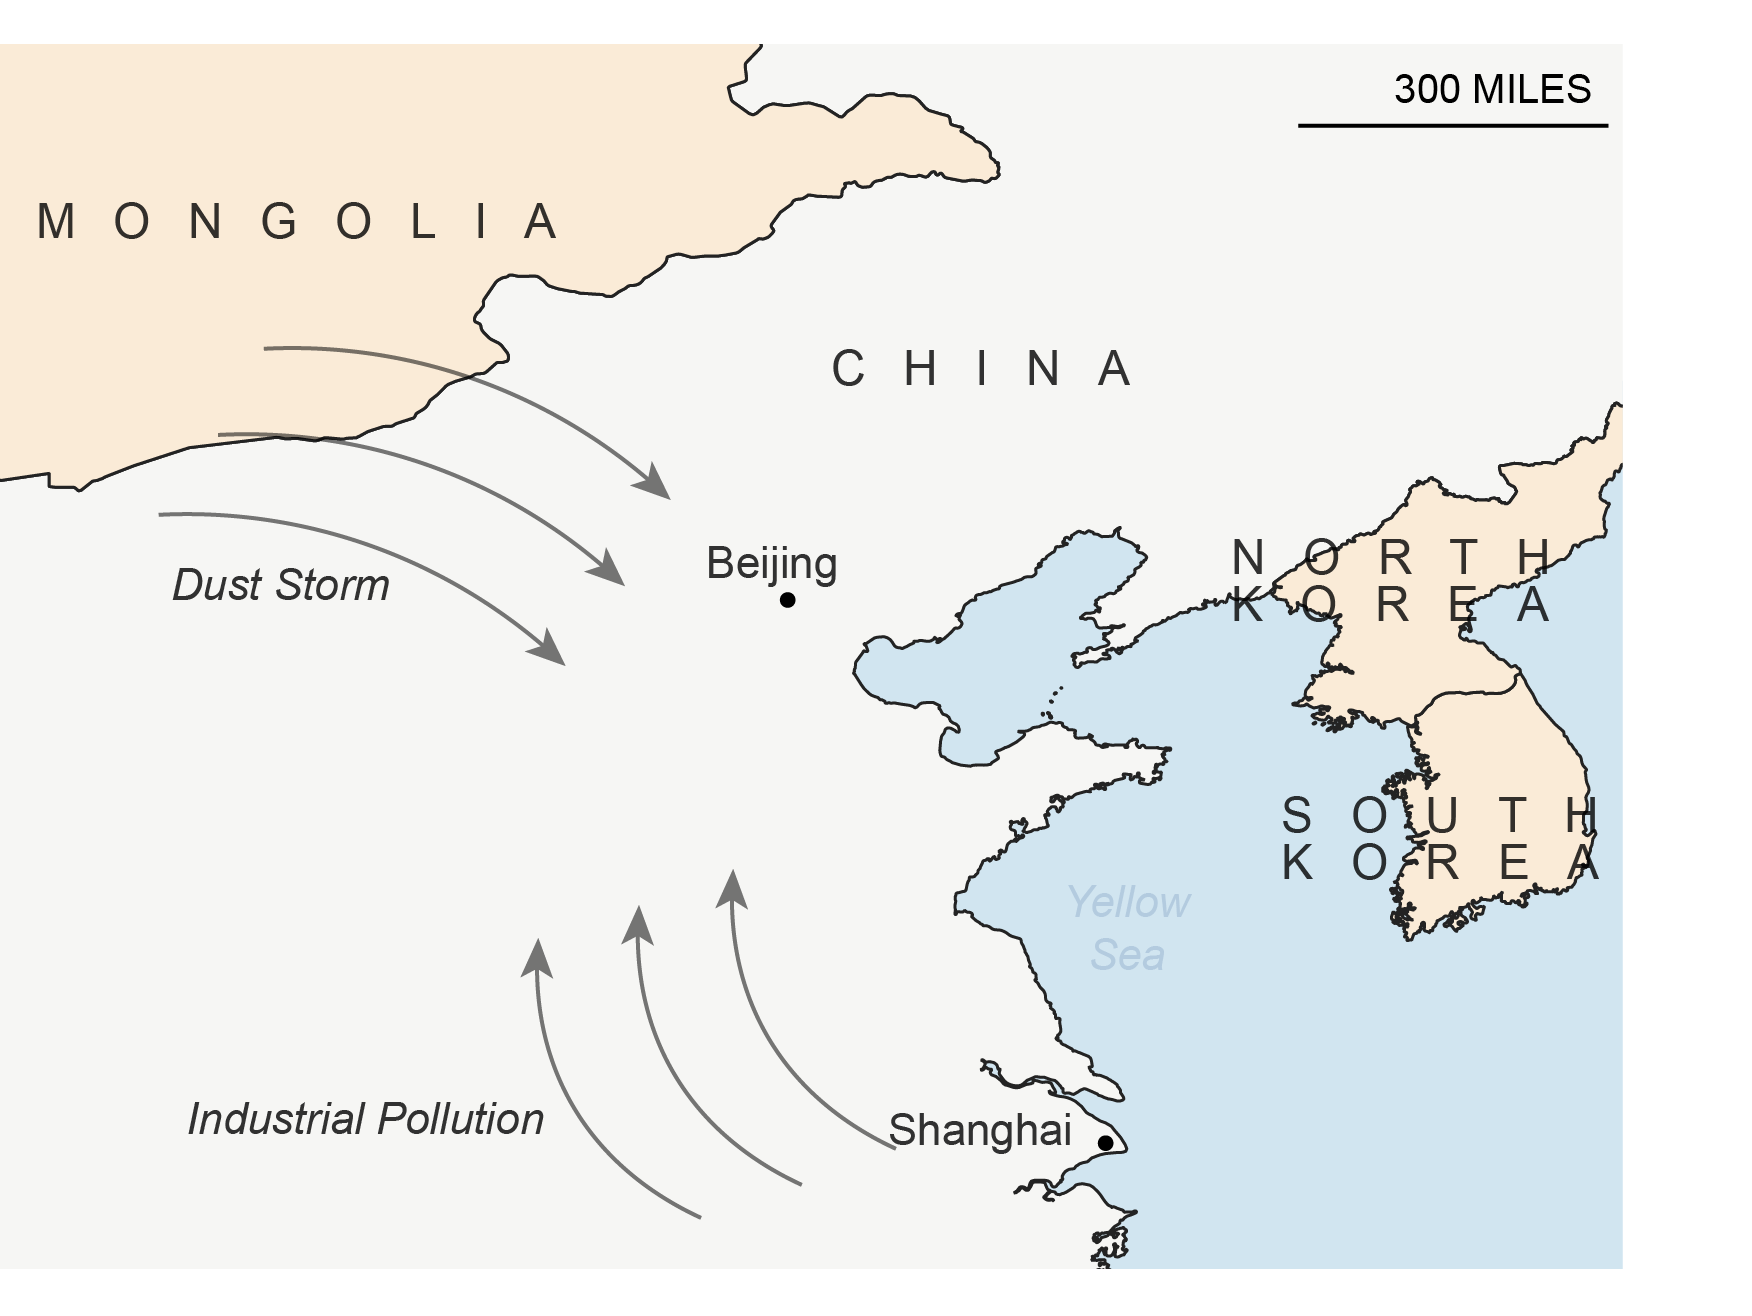
One third of Beijing’s air pollution comes from outside of the city. Strong winds intensify the smog by carrying pollutants from desert areas in the northwest and industrialized southern regions.
Source: Natural Earth Data
Inside the capital city, coal burning and car emissions are among the major sources of pollution. Since 2014, China has implemented new emissions standards and set limits on burning coal. It also banned the construction of new coal plants surrounding Beijing.
Source: The Guardian
The local government set up 36 detectors all over the city to monitor emission levels, the majority of which are concentrated in the municipal area. Any day with an average PM2.5 concentration level above 100 is considered as “severely polluted” and "very unhealthy" for human beings.
Data from each of the detector has showed that all of locations have seen the number of pollution days declined from 2015 to 2018. For example, in Qianmen, which is besides Tiananmen Square, the number of pollution days halved to 49 days in 2018, compared to 109 days in 2015.
Source: Beijing Municipal Environmental Monitoring Center
When it comes to each region, the average number of pollution days have all decreased.
Severe pollution days in 2015
Severe pollution days in 2016
Severe pollution days in 2017
Severe pollution days in 2018
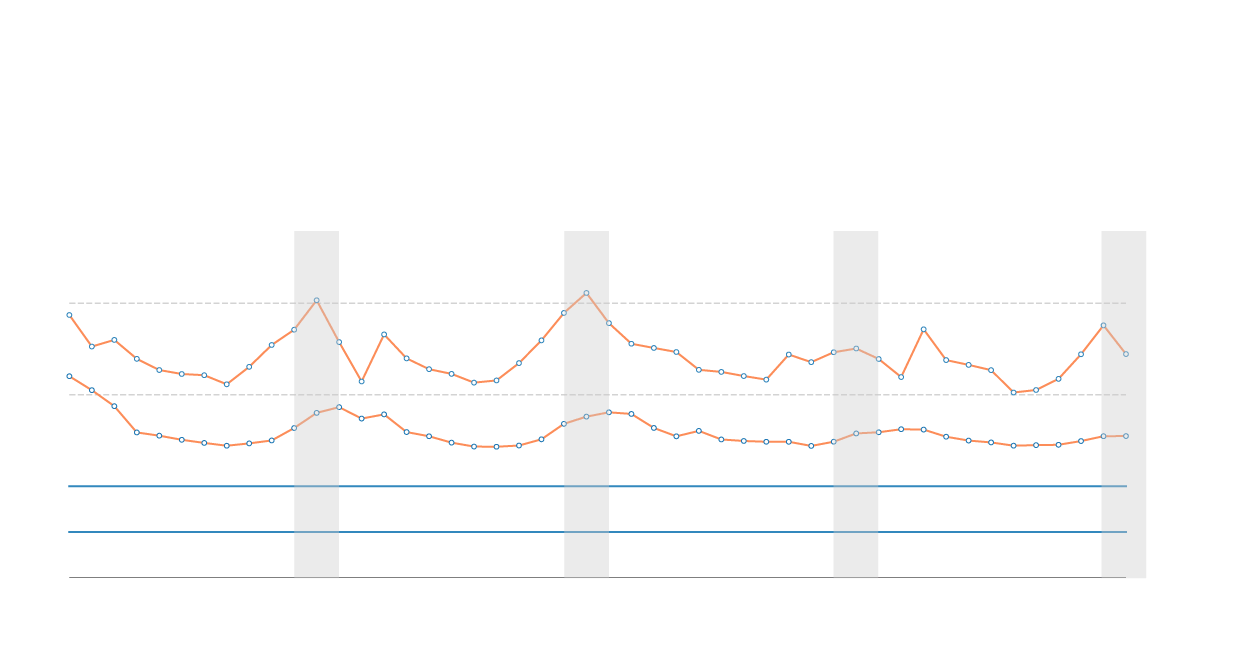
Beijing has made huge progess in fighting air pollution, but the war is far from the end. The city has indeed become less foggy, but in terms of other invisible pollutants, for example, sulfur dioxide (SO2) and nitrogen dioxide (NO2), their levels in the past few years haven’t reduced as significantly as PM2.5.
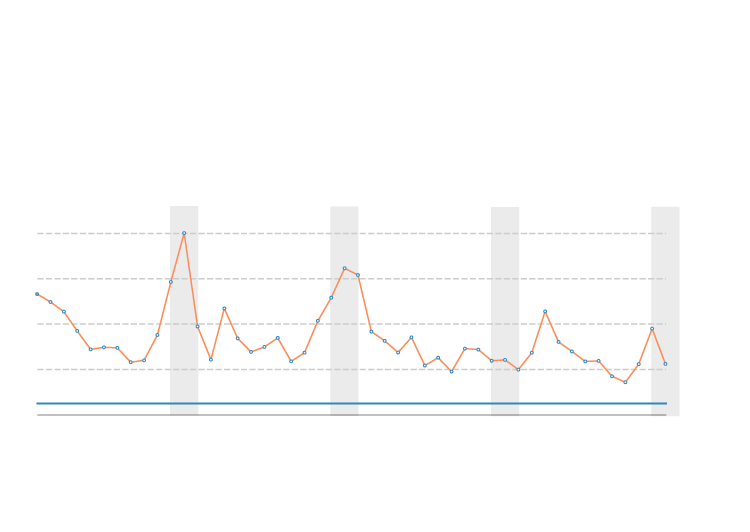
SO2, NO2 Emission Levels In Beijing By Month (2015 - 2018)
Winter
November to January
China bans coal heating
120
μg/m3
NO2
80
SO2
NO2
40
WHO
Standard
20
SO2
2015
2016
2018
2017
2019
Source: Beijing Municipal Environmental Monitoring Center
In other words, Beijing's war against these invisible pollutants has just begun.